
Vizgen MERSCOPE
This tutorial is for visualizing Vizgen MERSCOPE datasets.
In order to visualize your MERSCOPE dataset in BellaVista, you will need to create a dataset-specific JSON configuration file containing paths to the MERSCOPE outputs for your dataset. These output files will be processed to generate visualization files for BellaVista. Creating these visualization files will take a few minutes but only need to be created once. For subsequent runs, create_inputs can be set to False.
Configuration JSON file structure
{
    "system": "MERSCOPE",
    "data_folder": "/path/to/MERSCOPE_dataset_outs",
    "create_bellavista_inputs": true,

    "visualization_parameters": {
        "plot_image": true,
        "plot_transcripts": true,
        "plot_allgenes": true,
        "genes_visible_on_startup": false,
        "plot_cell_seg": true
    },

    "input_files": {
        "transcript_filename": "detected_transcripts.csv",
        "um_to_px_transform": "micron_to_mosaic_pixel_transform.csv",
        "images":  "mosaic_DAPI_z0.tif",
        "z_plane": 0,
        "cell_segmentation": "cell_boundaries"
    }
}
Input file parameters (MERSCOPE)
- transcript_filename: string
relative path to CSV file containing transcript spatial locations. If None, no transcripts will be processed
- images: string or 1D array of strings
relative path to image file(s). Must be a TIFF file. If None, no images will be processed
When visualizing a single image, provide the file path as a string. For multiple images, pass them as a list of filenames. For example, use "DAPI.tif" for a single image or ["DAPI.tif", "PolyT.tif"] for multiple images
- um_to_px_transform string
relative path to CSV file containing micron to pixel transformations. This is required if displaying images. If None, no images will be processed
- z_plane: integer, default=0
z-plane of segmentations to plot. We suggest this match the z-plane of the image you are visualizing. If None, the segmentations from the first z-plane will be processed
- cell_segmentation: string
relative path to cell segmentations. This must be a Parquet file (MERSCOPE v232 or later) or a folder containing HDF5 files (pre v232). If None, no cell segmentations will be processed
- nuclear_segmentation: string
relative path to nuclear segmentations. This must be a Parquet file (MERSCOPE v232 or later) or a folder containing HDF5 files (pre v232). If None, no nuclear segmentations will be processed
Important
All input file paths must be relative paths to data_folder
Note
If you are missing some input files, remove those input file parameters from the JSON file. BellaVista will skip the visualization of these data.
For example, if you do not have cell segmentations, the input file parameters in your JSON file might look like this:
"input_files": {
  "transcript_filename": "detected_transcripts.csv",
  "images":  "mosaic_DAPI_z0.tif",
  "um_to_px_transform": "micron_to_mosaic_pixel_transform.csv"
}
General parameters
- system: string
Value:
"MERSCOPE"
The input is not case-sensitive, so values "merscope", "Merscope", and "MERSCOPE" are treated equivalently- data_folder: string
The path to the folder where the dataset output files are stored. BellaVista visualization files will be saved in a new folder named
BellaVista_outputwithin the data_folder.- create_bellavista_inputs: boolean, default=true
Specifies whether to generate the necessary visualization files for BellaVista. It should be set to
truewhen loading the data for the first time. It can be set tofalsein later runs, as the files will already have been created.If set to
trueand the visualization files already exist from a previous run, BellaVista will skip recreating those files and only generate any missing ones.
Visualization parameters
- plot_image: boolean, default=false
Display image(s)
- plot_transcripts: boolean, default=false
Plot spatial coordinates of gene transcripts
- plot_allgenes: boolean, default=true
Plot transcripts for all gene IDs. If set to
false, only the gene IDs specified inselected_geneswill be plotted- genes_visible_on_startup: boolean, default=false
Controls the visibility of all gene layers at startup. If set to
false, the gene layers will be hidden
Setting this option to false improves navigation performance. Gene layers can be shown later using the toggle visibility feature.
- selected_genes: 1D array of strings, default=None
Specifies the gene IDs whose transcripts will be plotted. If None, transcripts for all genes will be plotted
- plot_cell_seg: boolean, default=false
Plot cell segmentation
- plot_nuclear_seg: boolean, default=false
Plot nuclear segmentation
- transcript_point_size: float, default=1
Size of the points representing individual transcript coordinates
- contrast_limits: tuple array of integers, default=None
Range of values [0, 65535] used to set the contrast limits for the displayed image(s)
- rotate_angle: integer, default=0
Rotation angle in degrees, within the range [0, 360], by which to rotate the data
Loading BellaVista
Once your JSON is correctly configured for your dataset, you can run BellaVista in the terminal:
Replace
my_dataset.jsonwith the filename of the JSON you created. The JSON file argument should contain the file path to your JSON file.
$ bellavista my_dataset.json
Note
It will take a few minutes to create the required data files. The terminal will print updates & have progress bars for time consuming steps.
Once loaded, you should see a napari window displaying your data. Now, you can interactively move around the napari canvas to explore the data. Try zooming in & out, toggling layers on & off to see different spatial patterns!
Tip
To visualize a single layer, and hide all other layers, Option/Alt-click on the visibility button (the eye, to the left of the layer name). Check out Helpful napari tips in the FAQ for more tips!
Refer to the tutorial below for a step-by-step guide on running BellaVista with a sample dataset and JSON.
If you encounter any issues, please check the FAQ. If you're experiencing issues not addressed in the FAQ, please check the open issues or open a new issuein our GitHub repository. You can also leave any feedback here!
Getting Started (with sample data)
Download sample data
Download sample data: MERSCOPE mouse brain dataset (slice 1, replicate 1) https://info.vizgen.com/mouse-brain-map
To download the dataset, Vizgen may ask you to fill out a questionnaire.

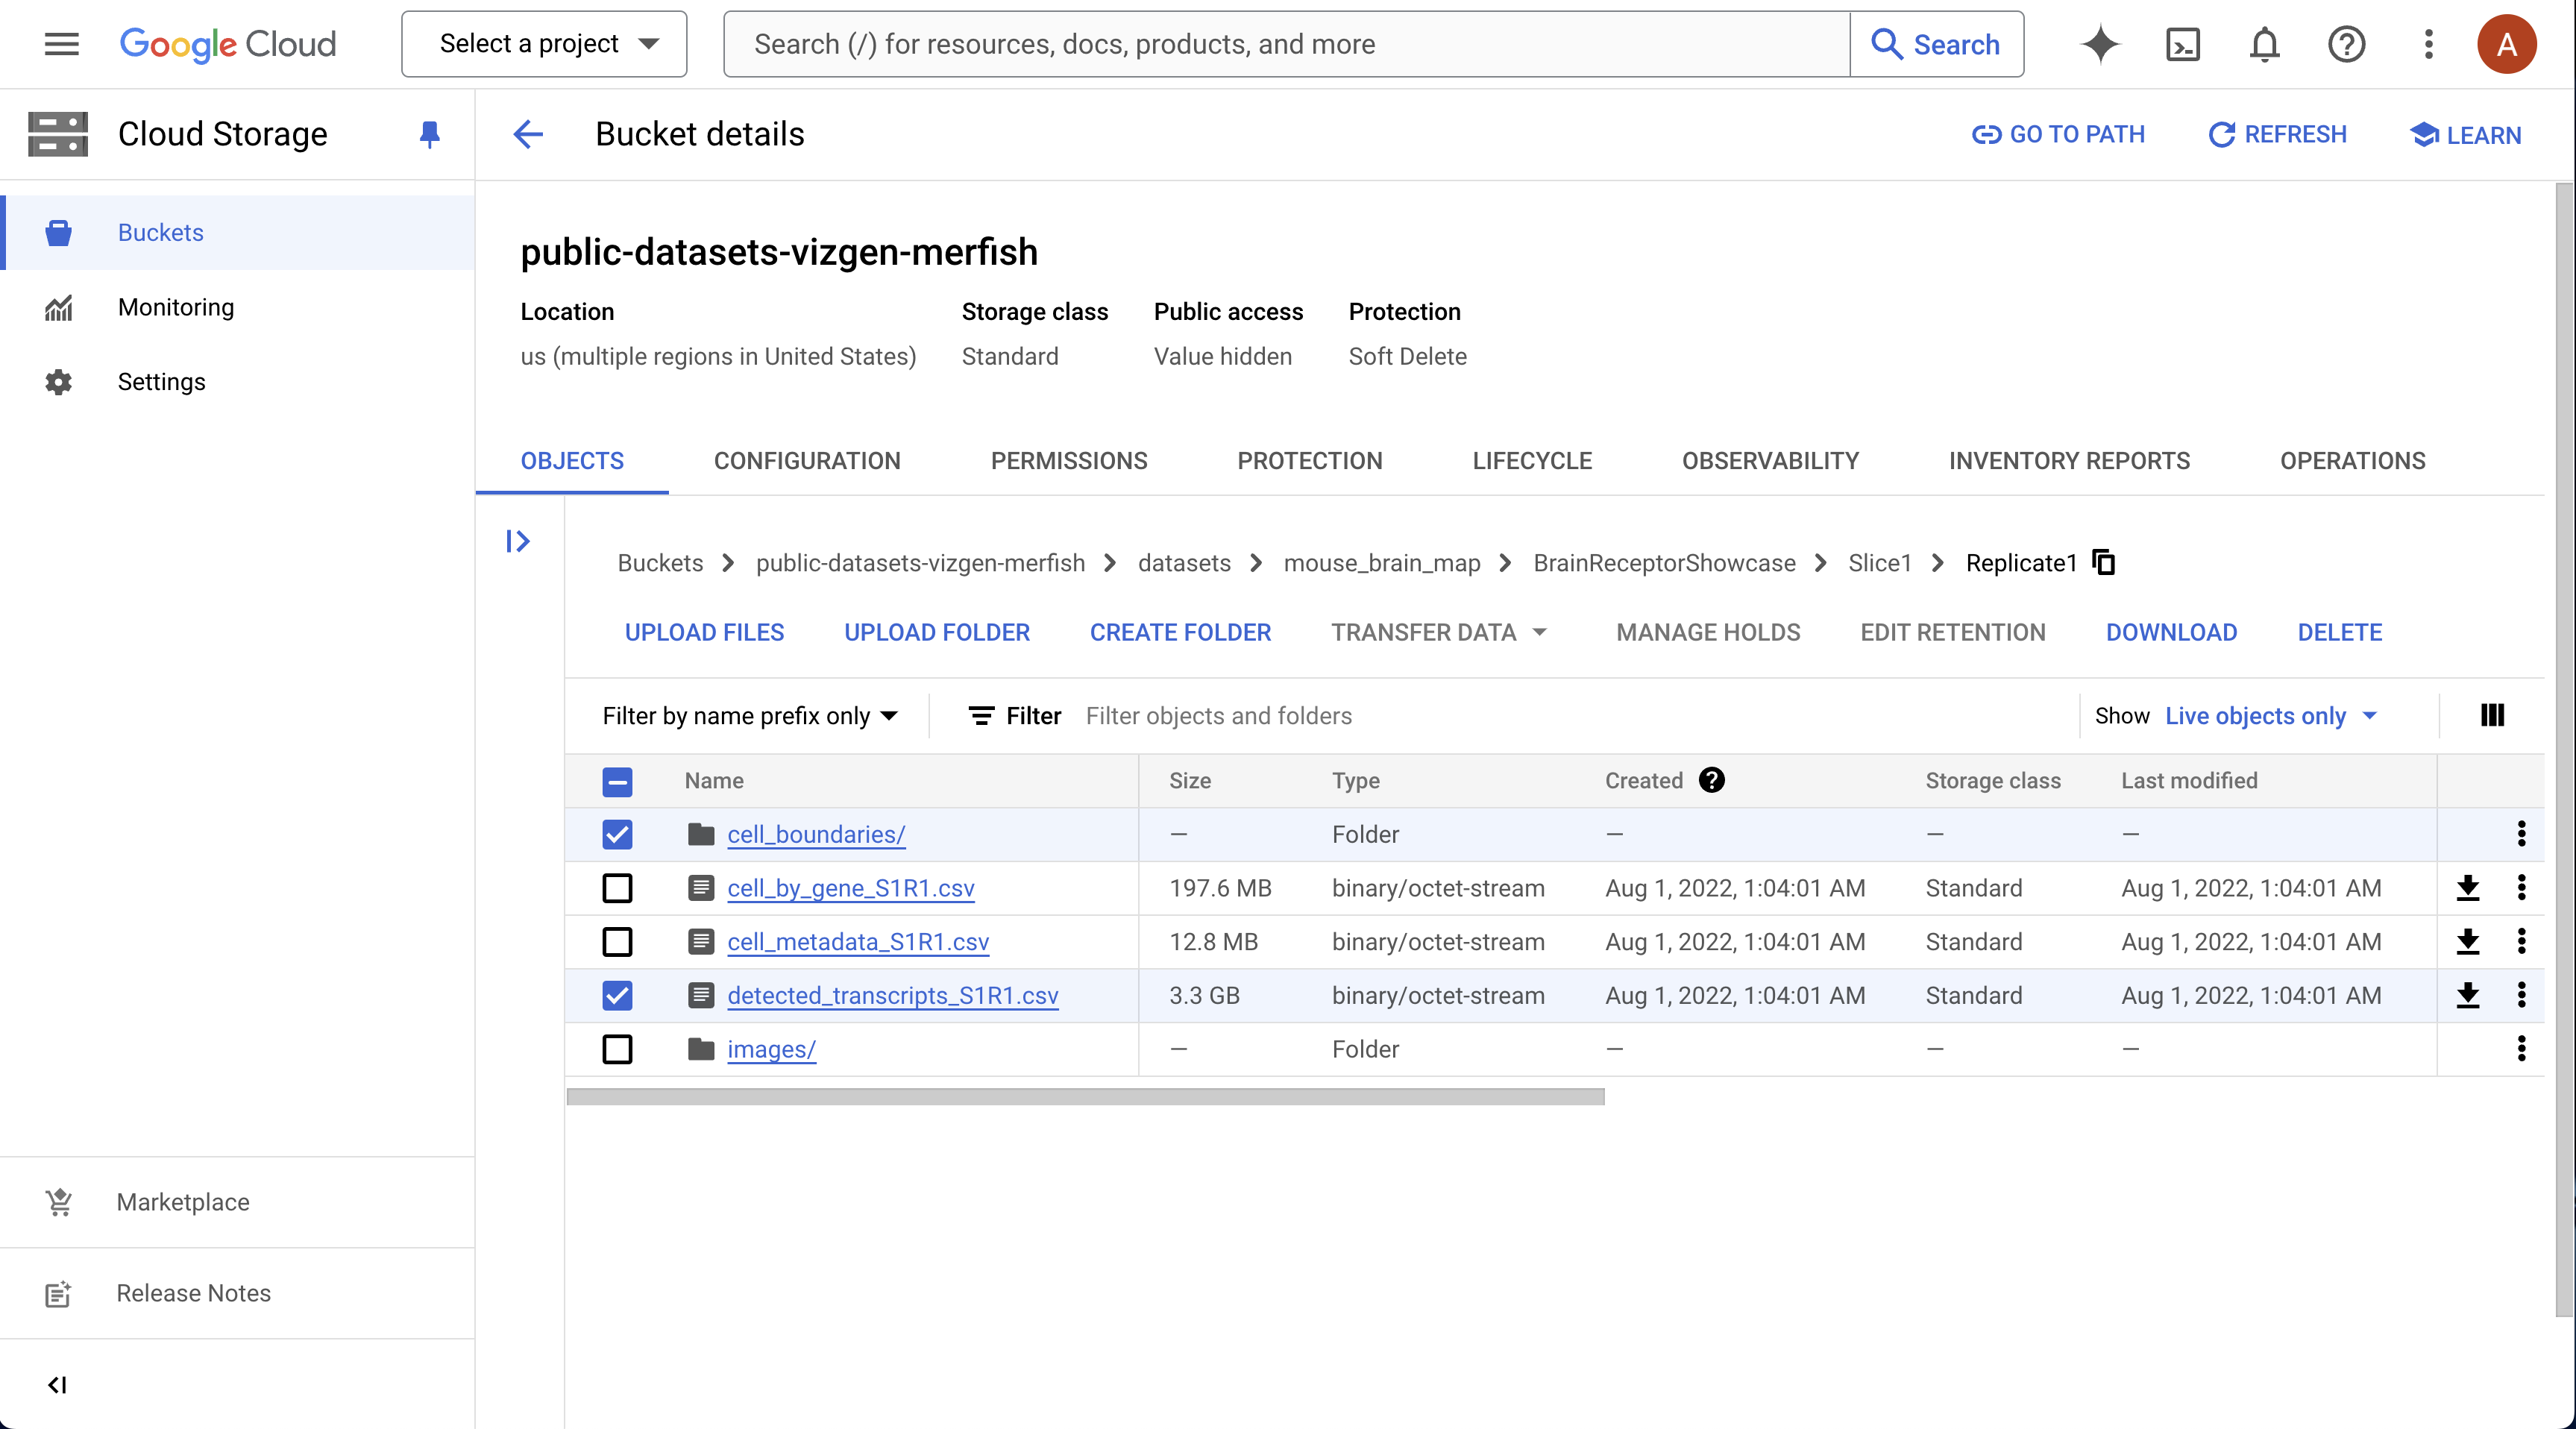
For this example, you only need to download:
detected_transcripts_S1R1.csvcell_boundaries/mosaic_DAPI_z3.tifµn_to_mosaic_pixel_transform.csvfound insideimages/
Note
To download the cell_boundaries folder, you may need to use gsutil (Google Cloud Console will prompt you if this is the case).
Here is some information on how to use gsutil: https://cloud.google.com/storage/docs/gsutil_install
For this example, we will visualize a subset of the genes which are listed in the visualization parameter selected_genes to speed up computation. If you wish to visualize all genes, set the visualization parameter plot_allgenes to true. If visualizing all genes, we recommend setting genes_visible_on_startup to false to improve navigation performance.
Load BellaVista
Download the sample JSON file from the GitHub repository: BellaVista/sample_json/merscope_sample.json
Replace the path in
data_folderPython cannot parse JSON files containing file paths with single backslashes (\). To avoid errors, use either forward slashes (/) or double backslashes (\\) when representing file paths in the JSON strings.
merscope_sample.json
{
    "system": "merscope",
    "data_folder": "/path/to/vizgen_brain_s1r1",
    "create_bellavista_inputs": true,

    "visualization_parameters": {
        "plot_image": true,
        "plot_transcripts": true,
        "plot_allgenes": false,
        "genes_visible_on_startup": true,
        "selected_genes": ["Fgfr2","Tmem108","Glp2r","Slc47a1","Tacr1","Th",
                            "Ntsr1","Sstr3","S1pr3","Sstr1","Ptgfr","Qrfpr",
                            "Gpr101","Drd5","Chat"],
        "plot_cell_seg": true,
        "transcript_point_size": 0.75,
        "contrast_limits": [0, 26000]
    },

    "input_files": {
        "transcript_filename": "detected_transcripts_S1R1.csv",
        "images":  "mosaic_DAPI_z3.tif",
        "um_to_px_transform": "micron_to_mosaic_pixel_transform.csv",
        "z_plane": 3,
        "cell_segmentation": "cell_boundaries"
    }
}
In the terminal, run BellaVista with the MERSCOPE sample JSON:
The JSON file argument should contain the file path to the JSON file.
$ bellavista merscope_sample.json
Note
It will take a few minutes to create the required data files. The terminal will print updates & have progress bars for time consuming steps.
Using this JSON file, the displayed output should look similar to this:

Now, you can interactively move around the napari canvas to explore the data. Try zooming in & out, toggling layers on & off to see different spatial patterns!
Tip
To visualize a single layer, and hide all other layers, Option/Alt-click on the visibility button (the eye, to the left of the layer name). Check out Helpful napari tips in the FAQ for more tips!
Note
Gene colors are assigned randomly every time BellaVista is launched. So, the gene colors displayed in your window will be different from the image above. See Helpful napari tips in the FAQ for commands to configure gene colors and other customizable visualization options.
To reproduce the same colors every time you launch BellaVista, see Creating your own figures! in the figure guide.
If you encounter any issues, please check the FAQ. If you're experiencing issues not addressed in the FAQ, please check the open issues or open a new issuein our GitHub repository. You can also leave any feedback here!